Header1200x385

facebook_page_plugin
× If you are studying for your BAK or PPL exams and need some help, please post your question here. Someone on the forum is bound to help you as soon as they can.

PPL Guide Exam Q62 - Take-off chart Type 1

  • Austin
  • Topic Author

Austin created the topic: PPL Guide Exam Q62 - Take-off chart Type 1

Next of my "I can't figure out why I got this wrong" questions....

Question refers to the Take-off Chart on p2 of Bob Tait's PPL Supplement, and reads:

"Give the following details:
Runway = 05/23
Take-off distance available = 1300m
Slope = level
Surface = long wet grass
Pressure height = 3000 ft
Wind = 230/10 kt
Temperature = +15 deg C
Take-off weight = 1050kg

The take-off distance required under the conditions given is closest to:"

Here is my working, which gives an answer almost spot on 1200m. However, the answer given as correct is (a) 1000m. I've pored through my work looking for a mistake, and I just can't find it. The climb is not weight-limited; what have I done wrong?


#1
Attachments:

Please Log in or Create an account to join the conversation.

  • Posts: 2447
  • Thank you received: 257

bobtait replied the topic: PPL Guide Exam Q62 - Take-off chart Type 1

You seem to have mis-read the Question. The question gave you the take off distance AVAILABLE, but it asks for the take-off distance REQUIRED. The take-off distance available is actually completely irrelevant to the question (examiners often do that). You should:
1 enter at 3000 feet
2 go to 15°C and move vertically up.
3 go to 1050 kg - up to level - over to long wet grass - across to hit the line coming up from 15°C.
That brings you out a little over 1000 meters.

By the way, you cannot extend (extrapolate) any lines on the chart. If you cannot hit a particular value, you must use the last value available on the chart.
#2
Attachments:

Please Log in or Create an account to join the conversation.

  • Austin
  • Topic Author

Austin replied the topic: PPL Guide Exam Q62 - Take-off chart Type 1

Doh! Of course - I just extended out at maximum take-off weight, rather than looking at the actual weight of the aircraft. (I realise the TODA was irrelevant - that's not how I reached my final point.....)

I'll try not to ask too many silly questions!

That's interesting, though, about not extrapolating any lines. It's one thing (and certainly a very important thing) to follow the instructions; but that just seems to defy the laws of physics. That would mean, for example, that 'your' aircraft with its TOW of 1050kg would have the same take-off requirement as 'my' aircraft with its TOW of 1090kg; and indeed, one could make up even more exaggerated examples in tail-wind situations, runway upslopes and the like. Can that really be true?
#3

Please Log in or Create an account to join the conversation.

  • Posts: 2447
  • Thank you received: 257

bobtait replied the topic: PPL Guide Exam Q62 - Take-off chart Type 1

Of course you still have to comply with the published limitations for your aircraft. It doesn't mean that if you actually weigh 1500kg you can use the 1100kg figures. In fact I don't know why they provide a line for 1100kg when the max weight permitted is 1090kg.

If a line is dashed, it is a limit. For example if the tail wind was more than 5kt, you couldn't take off on that runway, but if the headwind was more than 20kt, you could still take off but you could only use 20kt for the calculation. Likewise, if the slope was more than 2% up, you could not take off on that runway, but if it was more than 4% down, you could still take off but you could only use 4% for the calculation.

Also if the aircraft in your example weighed 1090kg, it couldn't take off if the grass was long and wet. It would have to wait until the grass dried out and someone mowed the lawn!!
#4

Please Log in or Create an account to join the conversation.

  • Austin
  • Topic Author

Austin replied the topic: PPL Guide Exam Q62 - Take-off chart Type 1

Certainly: if in doubt, don't do it. I thought your earlier comment ("If you cannot hit a particular value....") implied that I should just extend my red line on until I hit somewhere between 'long wet' and 'short wet' grass, which would clearly be just dangerous; far safer, as you say, to knuckle down and mow the lawn!

Thanks again for your help. Hope you had a wonderful Christmas, and best wishes for 2016!
#5

Please Log in or Create an account to join the conversation.

  • Posts: 2447
  • Thank you received: 257

bobtait replied the topic: PPL Guide Exam Q62 - Take-off chart Type 1

Remember these performance charts need to be taken along with a good deal of common sense. They look like a credible mathematical device but so much is simply someone's guess. For example, when it comes to a grass surface, how long is long? How wet is wet? What about a strip that's got long grass part of the way and short grass for the rest? What about a strip that's wet and boggy at one end and dry gravel at the other? What about a sandy strip with a grass cover like many off shore islands? Also who guessed the wind velocity by looking at a waving wind sock? What about a strip with a variable slope (many country strips have humps and dips in them). At best the performance charts are a rough guide, that's why they have large margins of error built in. Probably best to take the worst case if you are in doubt - and use your common sense.

Have a great new year
#6

Please Log in or Create an account to join the conversation.

  • Austin
  • Topic Author

Austin replied the topic: PPL Guide Exam Q62 - Take-off chart Type 1

Passed my PPL theory exam today (93% - I can live with that..... ).

Thank you, Bob, both for your wonderful materials (printed and online), and for your prompt and encouraging help on this forum. It may or may not be true to say "I couldn't have done it without you"; but without doubt it was easier with you!

(Now: should I consider tackling the CPL......? Hmmm......... :dry: )
#7

Please Log in or Create an account to join the conversation.

  • Posts: 2447
  • Thank you received: 257

bobtait replied the topic: PPL Guide Exam Q62 - Take-off chart Type 1

What a great result! You've made my day. Enjoy your flying now.

Bob
#8

Please Log in or Create an account to join the conversation.

  • John.Heddles
  • Offline
  • ATPL/consulting aero engineer
  • Posts: 843
  • Thank you received: 101

John.Heddles replied the topic: PPL Guide Exam Q62 - Take-off chart Type 1

A few observations -

(a) this style of chart derives from an old DCA (antecedent of CASA) tech memo (in a previous life, inter alia, I produced quite a few of this genre for flight manuals).

(b) That's interesting, though, about not extrapolating any lines The equations in this chart are fairly simple and a small extent of extrapolation won't hurt in the real world. However, the rule is no extrapolation because the general user has no idea what the equations of a graph are and, hence, you have no idea what the shape of the line will be outside the printed values .. in which case, extrapolation becomes fraught with the possibility of significant error. The problem is not a concern with linear or, even, quadratic but higher order polynomials and other forms of equations can have all manner of twists and turns ..

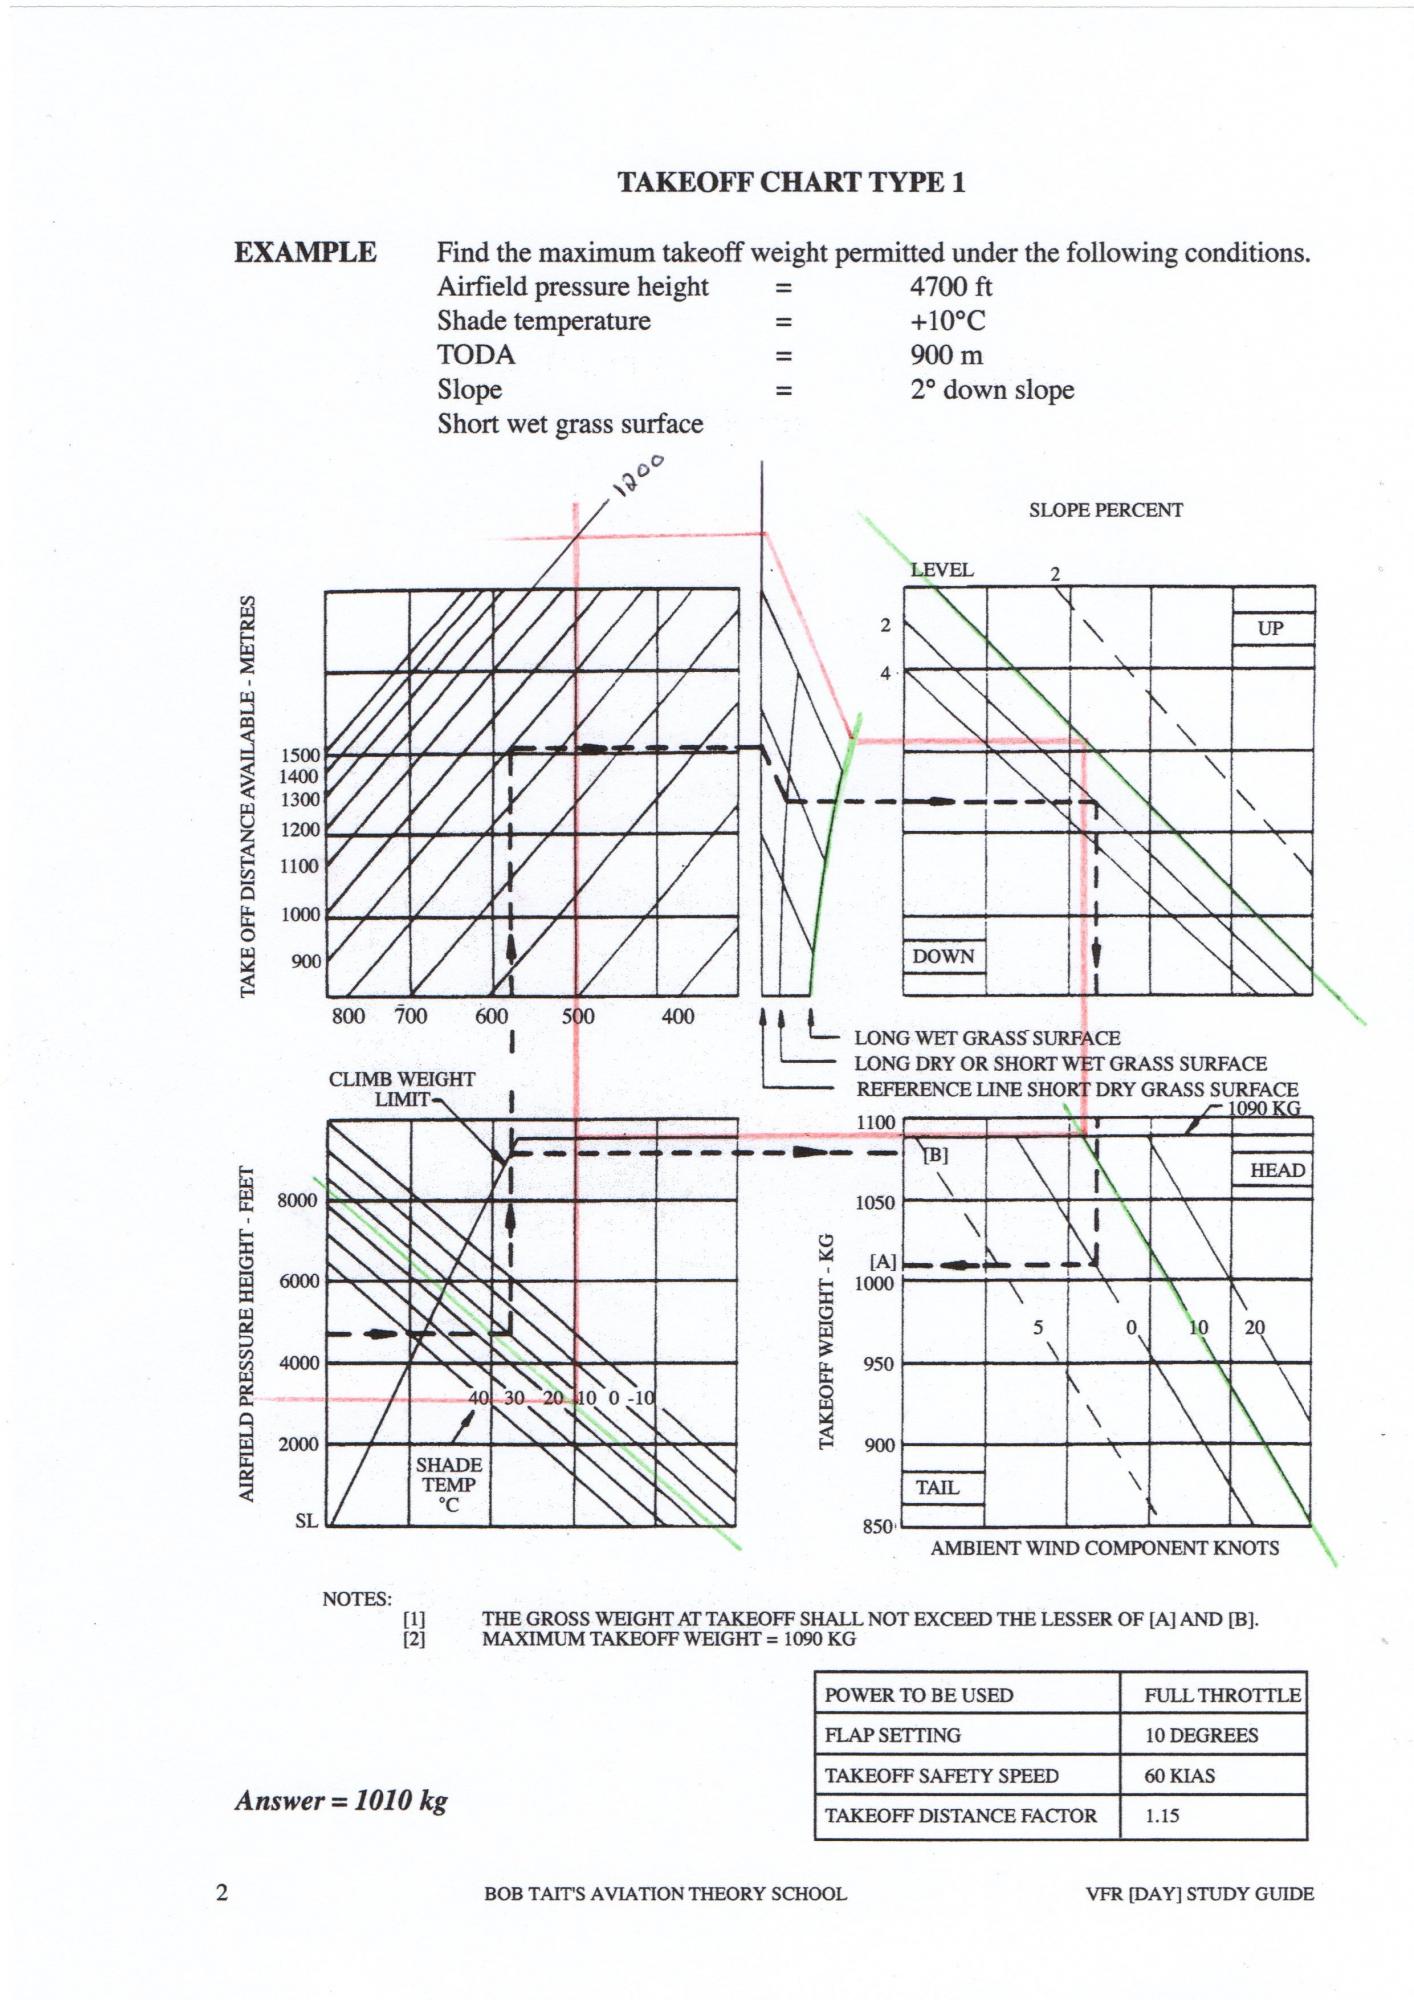
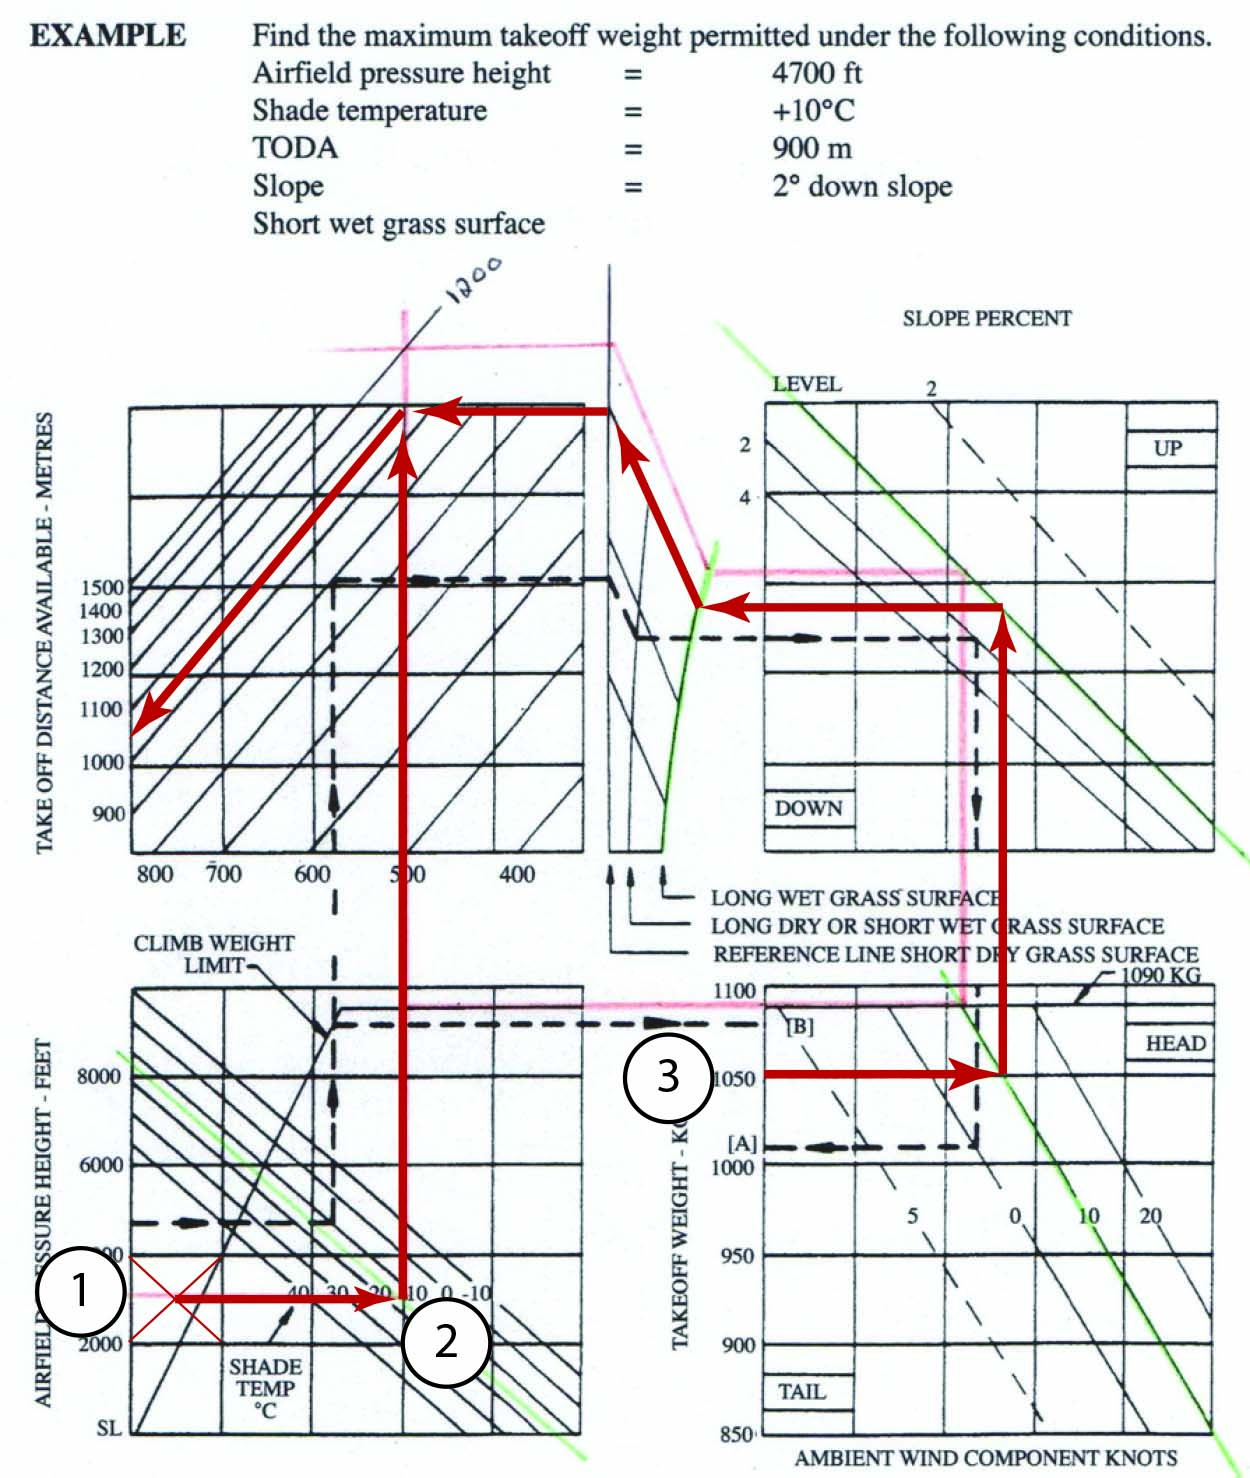
(c) I don't know why they provide a line for 1100kg when the max weight permitted is 1090kg Solely to make life easier for interpolation.

(d) until I hit somewhere between 'long wet' and 'short wet' grass, which would clearly be just dangerous The surface correction grid simply provides several lines for different mu values assumed for the surface in question. Interpolation is rather meaningless and ought not to be done.

(e) They look like a credible mathematical device but so much is simply someone's guess No guesswork involved. The carpets are based on comparatively simple equations from the DCA TM. The usual way we used them either was to run some simple flight tests to get several TOD/LD values for known ambients, or read off a couple from the US OEM unfactored data, and then expand those points using the carpet equations to generate the final chart. Providing that the expansion is between sensible flight test data, the chart will be usefully accurate. Apart from the design standard required 0.5/1.5 wind grid factors, the one area where a bit of fudge work comes into things is with the factors presumed for surface mu values.

(f) At best the performance charts are a rough guide, that's why they have large margins of error built in For the concerns listed, fair comment. However, one needs to keep in mind that the charts are based on presumed coefficients etc. .. if actual conditions don't resemble that which is presumed, accuracy gets a bit rubbery. No different for AFM performance data in Mr Boeing's or Mr Airbus' aircraft operations. Apart from the wind grid, generally no margins included other than the CAO distance factors .. which, for lighties, are a tad slim for comfort.

Engineering specialist in aircraft performance and weight control.
#9

Please Log in or Create an account to join the conversation.

Time to create page: 0.260 seconds