If I may add a few words to Stuart’s and Bob’s posts.
I would have expected both to have some relationship to the underlying ISA mathematical model.
That is the case. We can derive the two rate figures without too much effort from the atmospheric models.
We start with a mathematical ISA model of how temperature varies with height (from which we get the well-known pilots’ approximation of 15 deg C – 2 C deg x height in thousands of feet). This then allows us to model a pressure variation with height and, in turn, a density variation with height.
Two important concepts follow from this:
(a) “pressure height” is the height in the (mathematical) ISA where a particular pressure exists
(b) “density height” is the height where a particular density exists.
So, if we know what the pressure or density is somewhere, then we can figure out the height at which this pressure or density would exist in ISA and, so, figure out the pressure or density height. This we can do simply by looking up a table of data or running the equations as sums.
Pressure Height and 30 ft/hPa
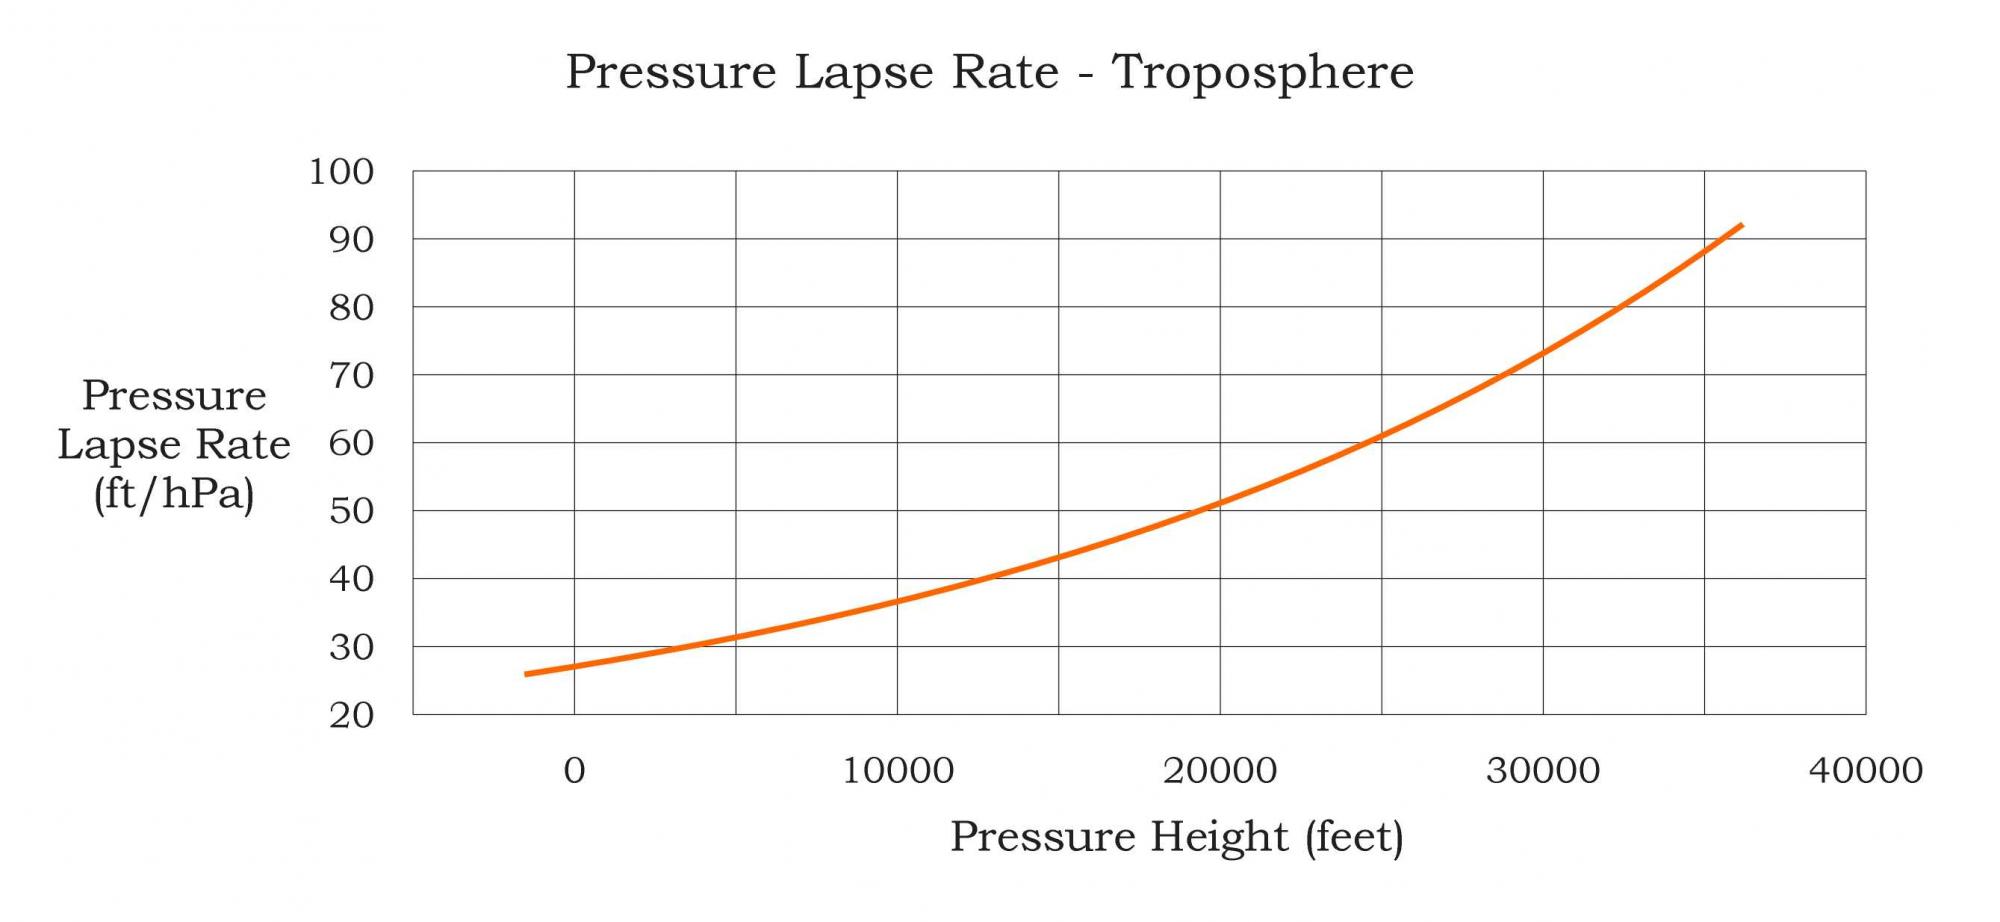
The pressure variation with height can be reworked to get the rate of pressure variation with height and, by looking to the reciprocal, the rate of height variation with pressure.
Traditionally, pilot calculations use a figure of 30 feet height change for each hPa variation in pressure. This, generally, is wrong as the actual figure varies very strongly with height. However, for the purposes of pilot calculations, where we are interested in takeoff and landing performance and low level terrain clearance, the calculations are reasonably fit for purpose.
The following graph gives you an idea of the rate variation for the troposphere. As the height increases, the rate (being exponential) ramps up very rapidly. For instance, at 50000 ft, we are looking at a figure a little below 180 ft/hPa.
While we might use the 30 ft/hPa rate value for all exam calculations, we should keep in mind that it is pretty silly and not at all appropriate for calculations relating to higher levels. The discrepancy between the actual exponential variation and the constant pilot calculation figure leads to much confusion when pilots run inappropriate calculations and then can't reconcile the difference between ISA tabular pressure data and their calculations.
Density Height and 120 ft/C degree deviation
If we know the pressure height, we can use standard equations in ISA-speak to work out the density at that height both for standard and non-standard temperatures. In turn, we can then use the density by height equation to figure out the height in “standard” ISA conditions at which a non-standard density occurs (ie density height).
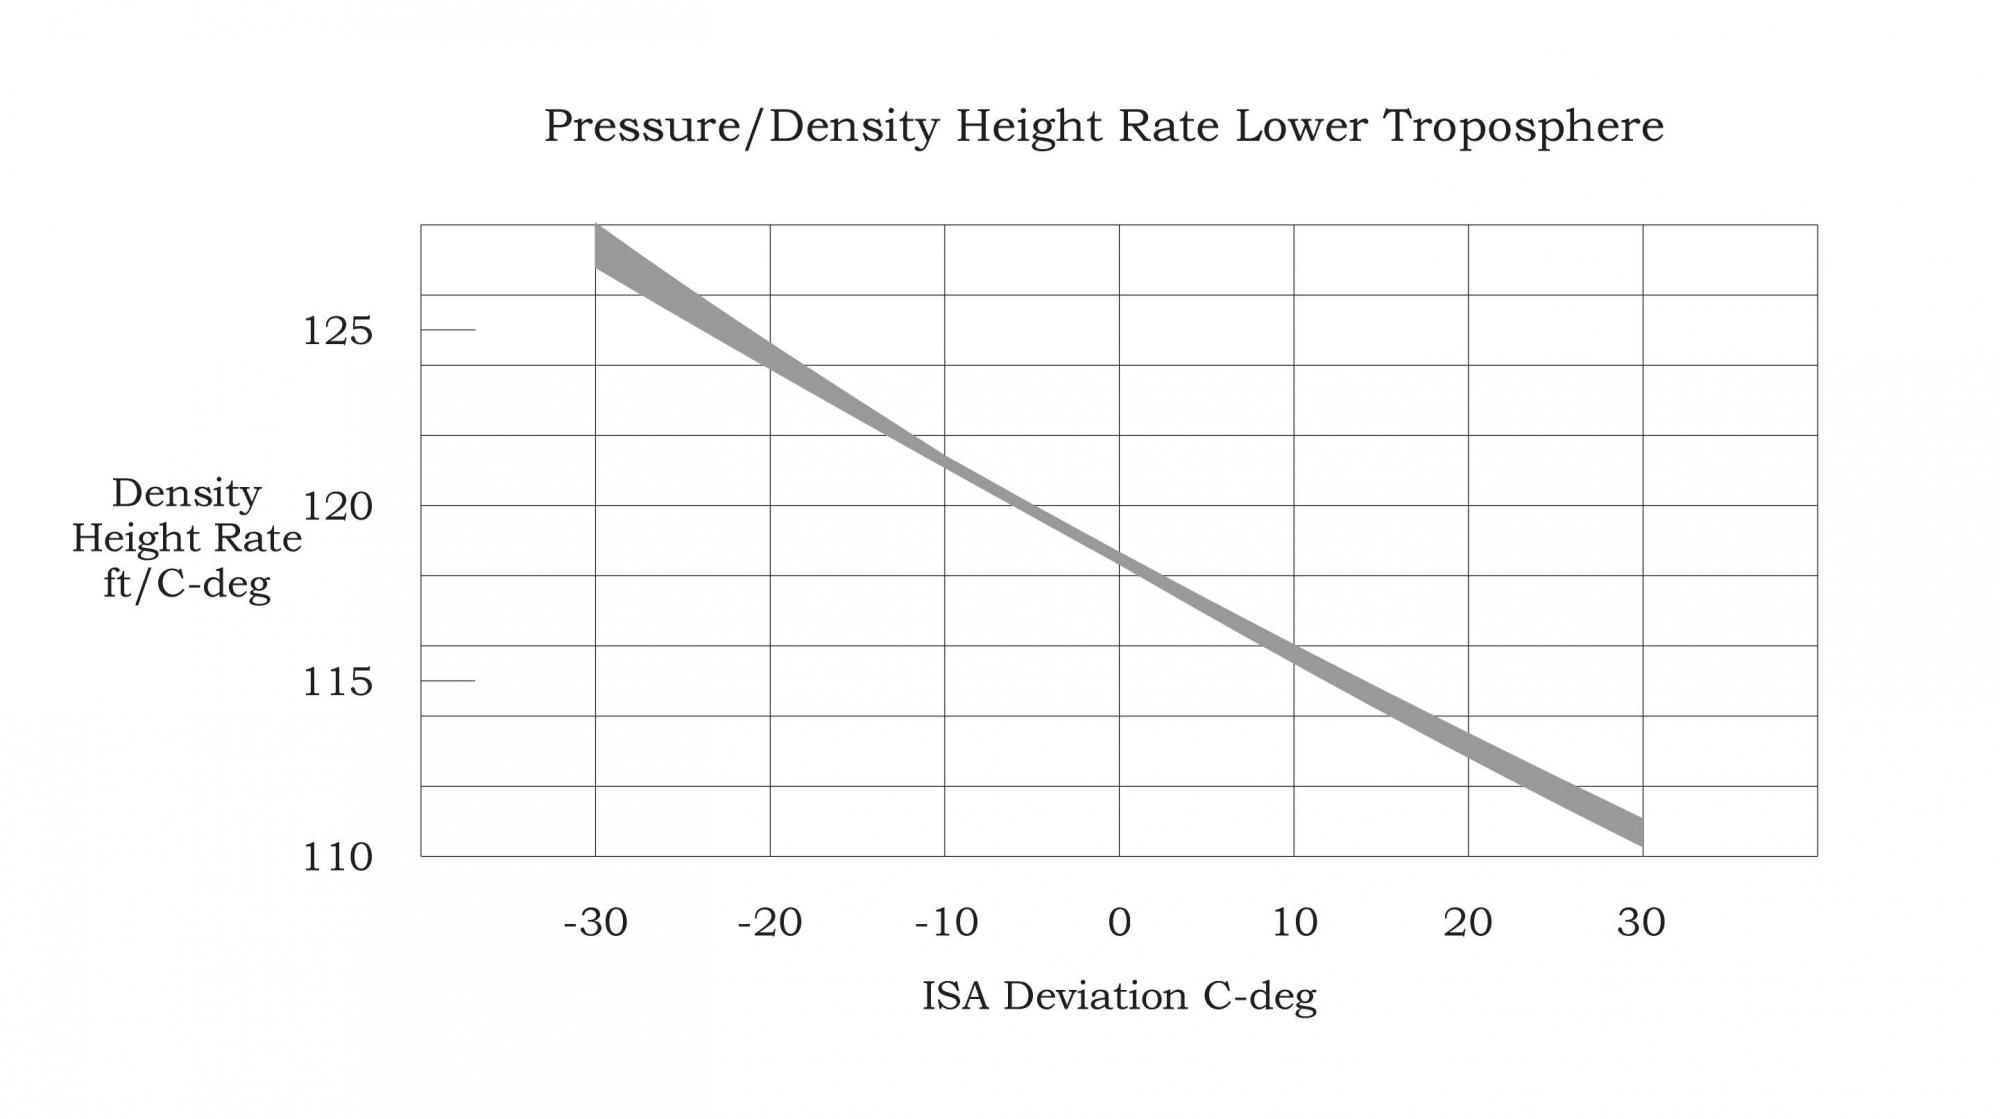
We then can run some calculations of rates of density height variation with temperature deviation (temperature variation, or offset) from standard ISA conditions. The following graph shows the sort of variation for pressure heights to 15000 ft and for temperature deviations in the range ISA-30 to ISA+30.
If we model these curves with straight lines (they aren't quite straight, but fairly close) it just so happens that the various (straight) lines intersect nearly at ISA + 0 at a value close to 118.8 ft/C deg so that would look to be a pretty good mean value to use following a similar reasoning philosophy to the pressure height figure discussed previously. You will see this approximate figure in various textbooks and other technical papers – eg the US National Weather Service.
Now, fortunately, whoever came up with the 120 ft/C deg rate figure we use, generally, for pilot calculations, had enough sense to realise that
(a) no-one in their right mind would want to use a figure like 118.8 ft/C deg when, for pilots, we like to facilitate mental calculations
(b) 120 ft/C deg is very nearly the same as 118.8 (about 1% difference)
(c) far more importantly, 120 = 12 x 10. Now, up until the early 1970s, when electronic calculators first started coming onto the scene, EVERYONE learned, and could parrot off, their multiplication tables. This meant that, by using 120 (rather than that silly 118.8) we could all do these sums in the back of our heads while doing ten other things at once in flight.
So, once again, like the 30 ft/hPa, 118.8 (or 120) ft/C deg is applicable for one (itself approximate) condition only. So far as we need to run sums in a manner which is fit for purpose (ie takeoff and landing), it is suitable for use, given the normal safety margins we build into our flying protocols.
Accuracy and Precision in Calculations
So, the calculations we use routinely are a bit rough and ready (although reasonably fit for purpose).
There is no point, or justification, in running your calculation sums to the nth decimal place, is there ? Might I suggest that you just run your exam calculations to the nearer foot – and, even then, we really are having ourselves on a bit.
When Did the Rate Figures Originate in Pilot Practice ?
I don’t know the answer because I have never been able to locate a paper or text which claims an answer. However, it is unlikely that they predate WW1 military aviation or post-date the introduction of the sensitive altimeter in the late 1920s. The first generally accepted atmospheric model was introduced in the 1920s, although work on less rigorous models dates back quite some time prior to that decade.